| System Features
iSCADA is ideal for managing accounts with
large number of sites and/or large number of systems. The
strength of iSCADA lies in its ability to configure, organize
and present huge volumes of data in a simple user interface.  It
is an engineering solution designed for non-technical users, and
caters for all levels of management. It
is an engineering solution designed for non-technical users, and
caters for all levels of management.
Manage Multiple Projects
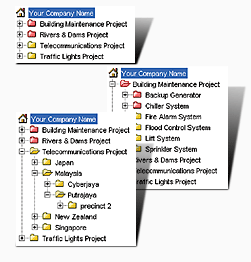
iSCADA users may manage multiple projects from a single Graphical User Interface. Using the familiar file folder system, events from different projects are organized in their respective folders for easy access.
This feature enables enterprises to consolidate all their monitoring and control of remote field assets into a unified solution. Top level management is able to obtain enterprise-wide real-time system status from a single login from any Internet connection.
Monitor by Location or by System
A local branch or country subsidiary may be interested to view data from a specific locality only. Likewise, an air conditioning technician would not want to be distracted by events from a fire alarm system. The same set of data can be organized by location or by system to suite each user's requirements.
When an entire enterprise's remote monitoring functions are managed by iSCADA, the volume of data can be very huge. This feature ensures that there is no information overload, and that users are only presented with relevant data.
 Consolidated Online Reporting Consolidated Online Reporting
Since the entire enterprise's data is available to any level of management from the desktop, iSCADA eliminates the traditional practice of generating and compiling reports from disparate systems for
presentation to higher management.
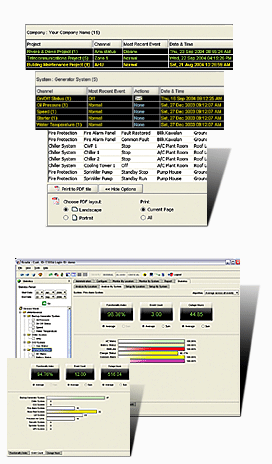
iSCADA generates customizable historical reports that can be converted into temper-proof PDF files for
printing or transmission by email.
Clean & Simple Statistical Analysis
Key Performance Indicators (KPIs) and Benchmarking Indices are dynamically computed for assets at any level of an enterprise - by project, by location or by system.
Availability Index, Failure Counts and Outage Hours are available at the enterprise's level down to the event level for every piece of asset.
Real
Time Condition Monitoring & Trending
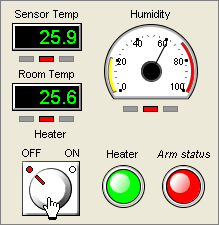
Inputs from any analogue channel can be viewed together on
an user-configurable Instrument Panels as a line chart, LED
readout, dials, etc. Sampling routines may be manual or
automatic, allowing users to configure the system to
automatically take samples all year round at predetermined
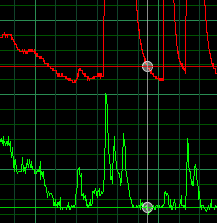
intervals. Historical data may be retrieved for trending and
analysis.
 
|


